How it works
Five steps from scattered charges to real answers — all on your device.
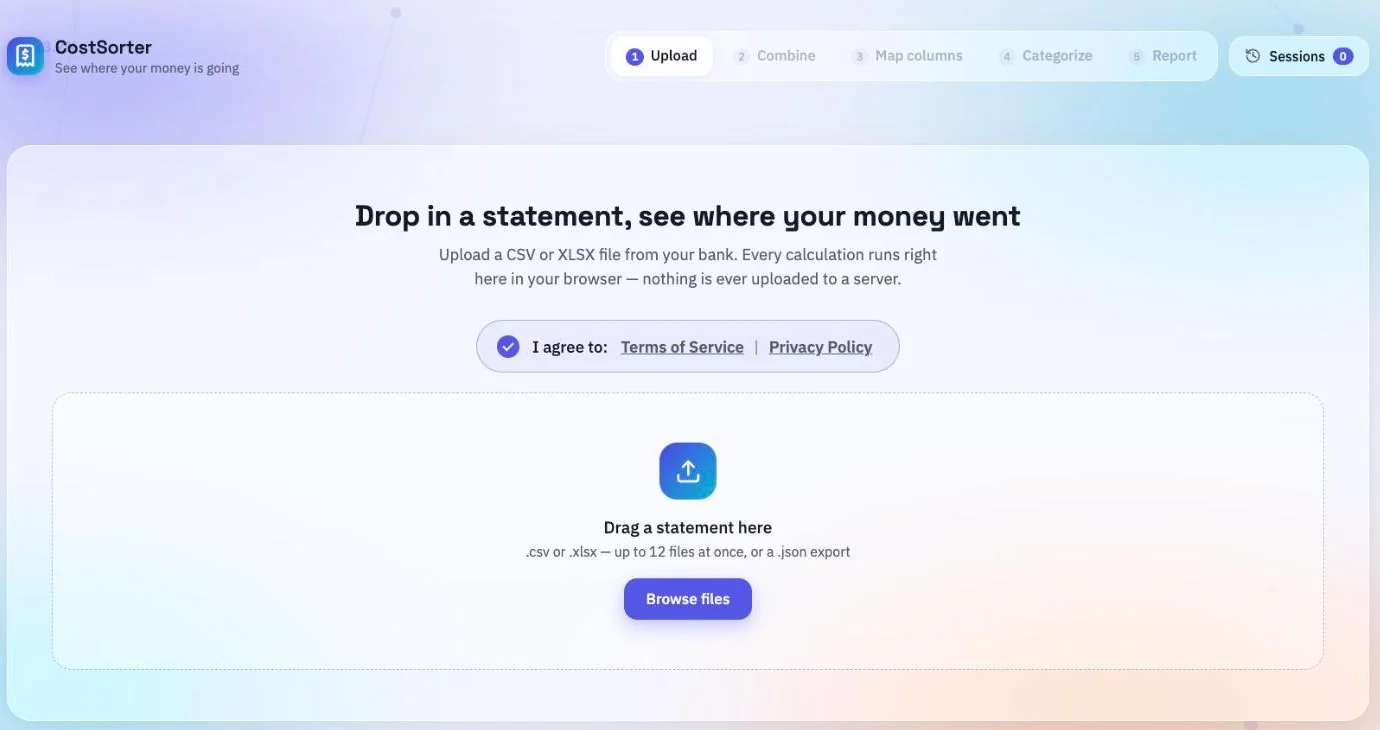
1. Upload
Drop in up to 12 statement files — .csv, .xlsx or
.xls — exported from your bank, card issuer or accounting software. You can
also re-open a sheet you previously exported from the app as JSON.
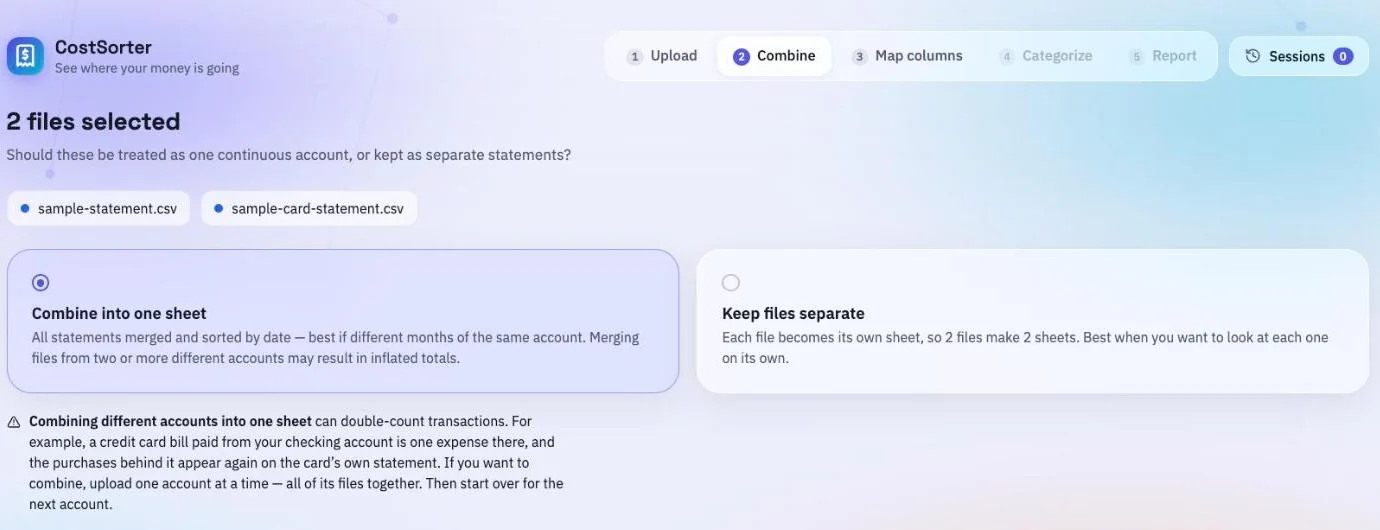
2. Combine, or keep them separate
With more than one file, you choose how they're combined: merge them into a single sheet sorted by date, or keep one sheet per file and switch between them later. Merging suits files that cover the same period — e.g. a checking account and a credit card for the same month.
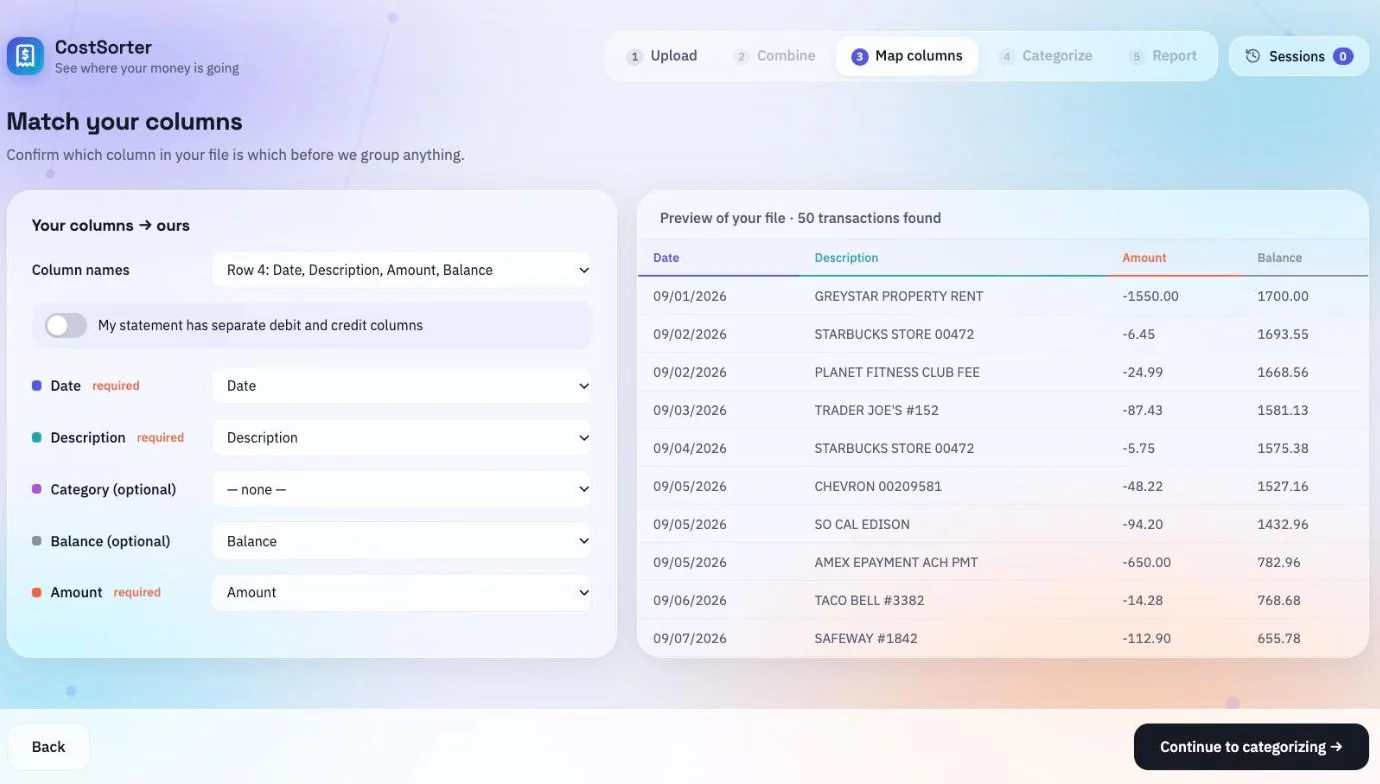
3. Map the columns
Banks disagree about what a statement looks like. The app reads your file, guesses which row holds the headers and which columns hold the date, description and amount — or separate debit and credit columns — and shows you a live preview with the mapped columns coloured. Correct anything it got wrong before continuing; it won't let you proceed while a file reads no transactions at all.
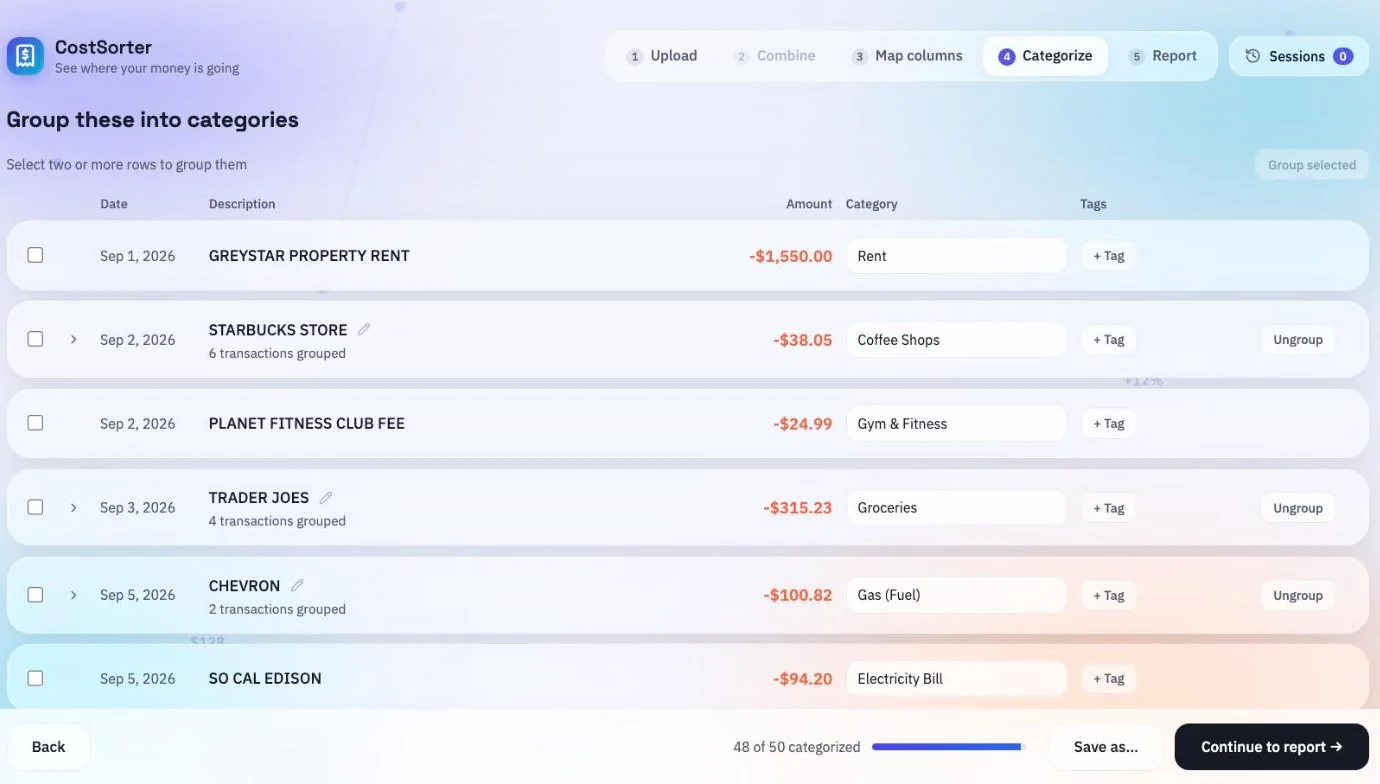
4. Categorize
This is where the work is, so the app does as much of it as it can. Transactions with the same wording are offered as a group you can categorize in one go. Categories are filled in from the merchant name when the app recognizes it. Anything it doesn't recognise is left for you.
A filled-in category is a suggestion rather than a decision — change it, clear it, or leave it. Anything you categorize yourself teaches the rest of that sheet: label one coffee shop and the others are suggested, never applied without you. You can group transactions by hand, name a group, add tags, and take individual transactions back out of a group.
5. Read the report
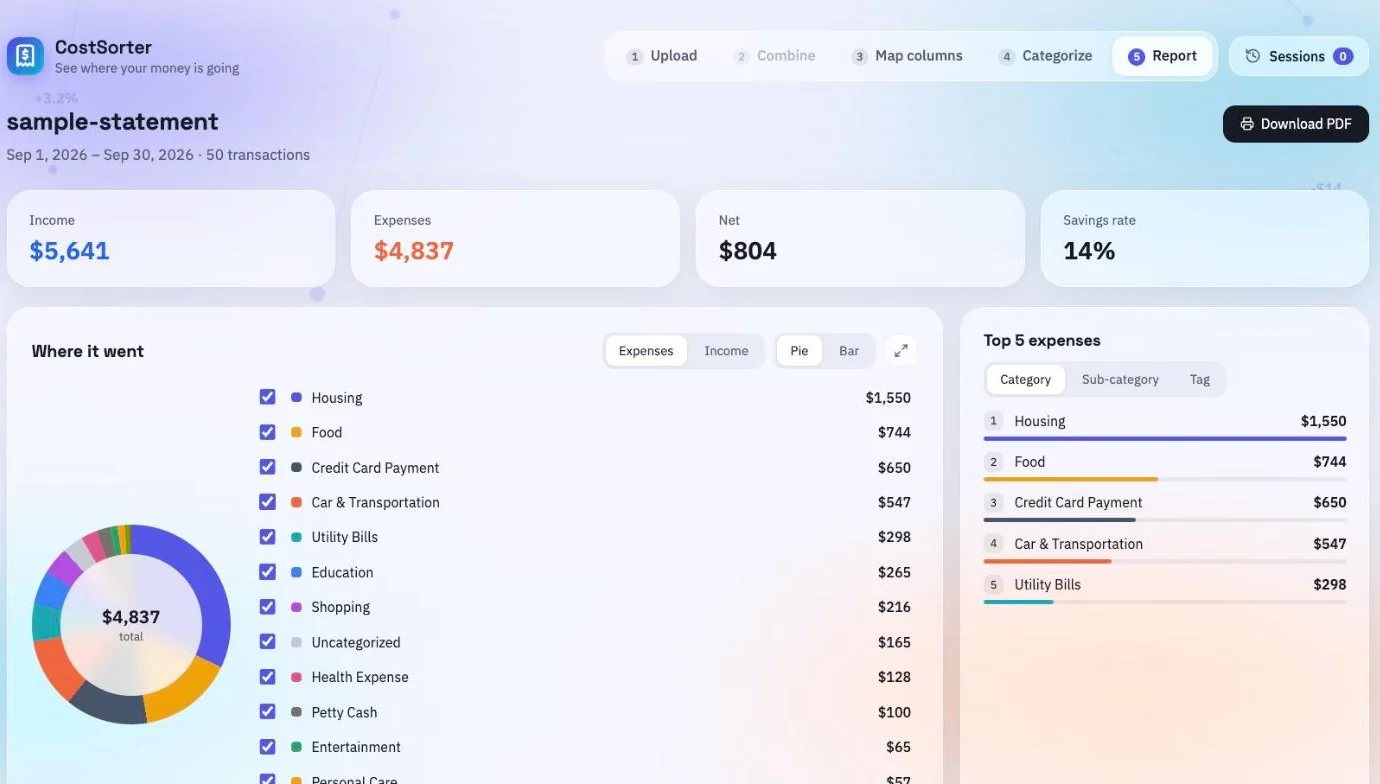
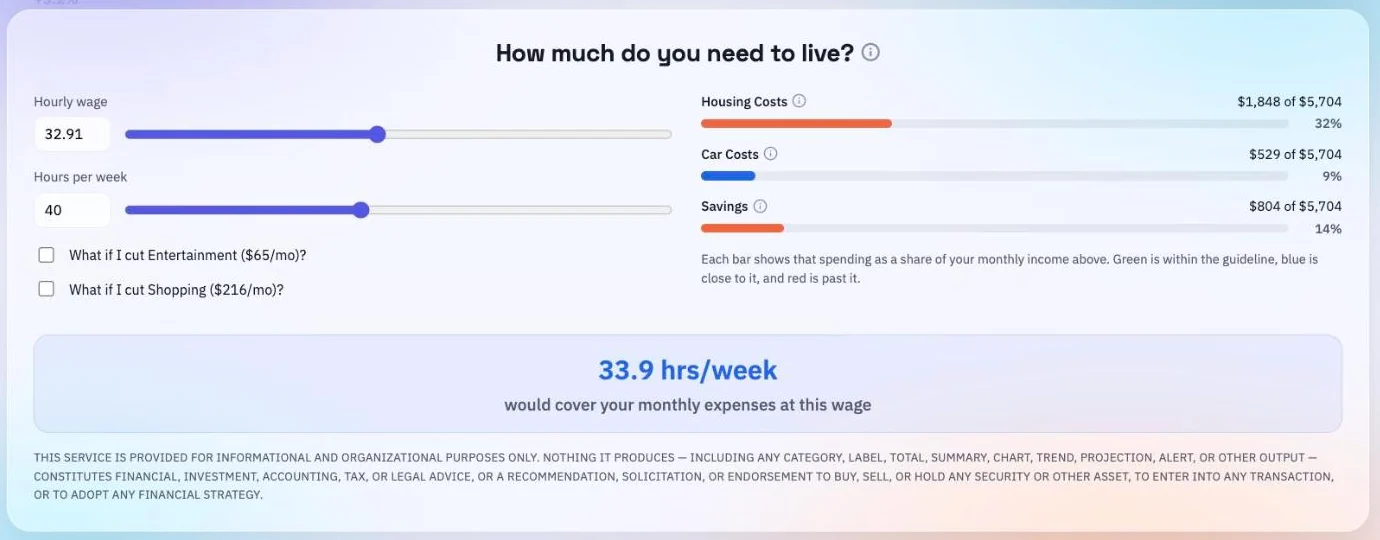
Income, spending, net and savings rate; a donut or bar breakdown by category whose legend highlights the matching transactions; what you kept over time, with both lines adding up from the start of the period; your top five expenses by category, sub-category or tag; and a budget view that starts from what your income works out to per hour.
Filter the whole report by tag, or switch a category off to see the rest without it. Then save the sheet to this browser — optionally locked with a password — or export it as CSV or JSON, or print it as a PDF.
The budget view measures your housing, your car and what you keep against three published benchmarks. If you want to know where the 30%, 10% and 15% come from, or whether they are worked out on your pre-tax or post-tax income, both are answered in the FAQ.
What it doesn't do
It doesn't connect to your bank. There is no login to your financial institution, no account aggregation, and nothing to authorise — you bring the file yourself. It also isn't advice: it's arithmetic on the data you give it, plus automated guesses about what each transaction was. Check the figures against your own statements before relying on them.
Go to app